Employment in Roanoke Region Reaches Highest Levels Since 2007
There’s good news in the Roanoke Region job market. Employment is up; unemployment is down.
Private sector employment is at the highest point since 2007 in the Roanoke market. The Roanoke metro market has seen 1,900 jobs added since this point last year. The trend line is strong and positive.
The region has seen the highest levels of growth in professional and business services (everything from legal, accounting, design, architecture/engineering, information technology, scientific research and development, advertising, company management, and administrative support industries) and in education/health services, which together added 1,500 jobs. Manufacturing, wholesale trade, and transportation and utilities also contributed to overall employment growth.
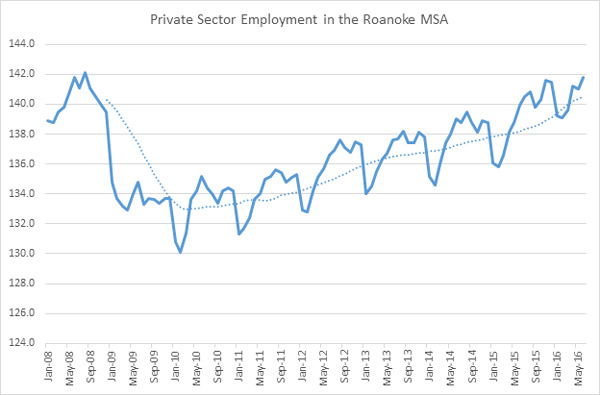
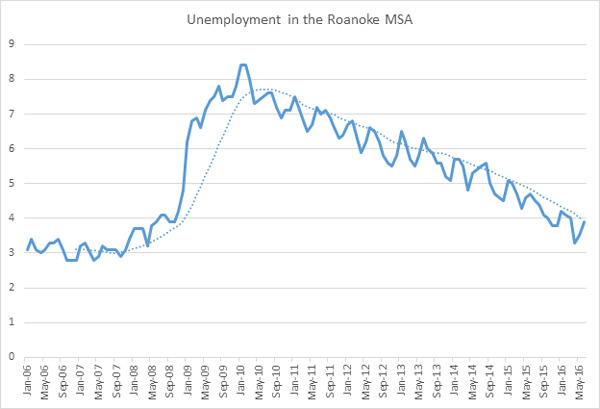
The labor force has grown considerably since the onset of the recession, and the Roanoke market has not seen the same national trend of large numbers of individuals leaving the labor force out of sheer discouragement.
Overall, participation is slightly lower in Roanoke than nation-wide but Roanoke hasn’t seen the same mass loss of civilian labor force participants (folks dropping out of the labor force) that the U.S. saw and still feels the effect of. Participation is up in Roanoke among every age cohort except those aged 20 to 24. Interesting is the growth in participation among 65 above. There has been a huge increase in participation among older working cohorts in Roanoke that hasn’t happened at the same level nationally. Participation grew in Roanoke from 2009 to 2014 (most current data available at this level).
| Roanoke 2009 | Roanoke 2014 | U.S. 2009 | U.S. 2014 | |
| Age 16 and over (total) | 62.0% | 62.2% | 65.3% | 63.3% |
| 16 to 19 | 44.3% | 48.4% | 40.1% | 37.6% |
| 20 to 24 | 84.4% | 77.3% | 75.0% | 74.1% |
| 25 to 44 | 82.5% | 83.7% | 83.3% | 82.0% |
| 45 to 54 | 78.7% | 78.9% | 81.3% | 79.9% |
| 55 to 64 | 65.1% | 65.4% | 64.6% | 64.2% |
| 65 to 74 | 22.8% | 25.3% | 24.8% | 25.3% |
| 75 and older | 2.5% | 10.4% | 5.6% | 6.3% |
| Total Labor Force Participants | 150,657 | 159,134 | 157,374,422 | 160,521,803 |
| Percent Change 2009-2014 | 5.6% | 2.0% |

