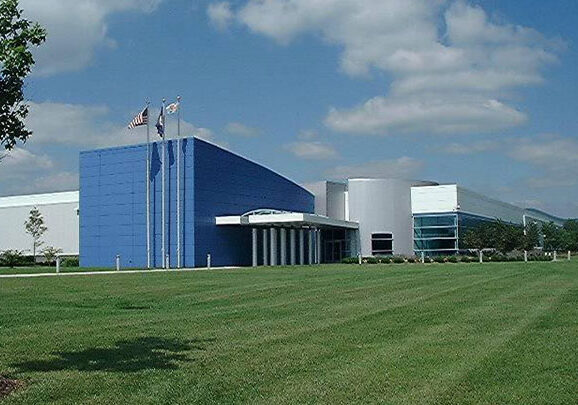
Diverse population in a mountain metro
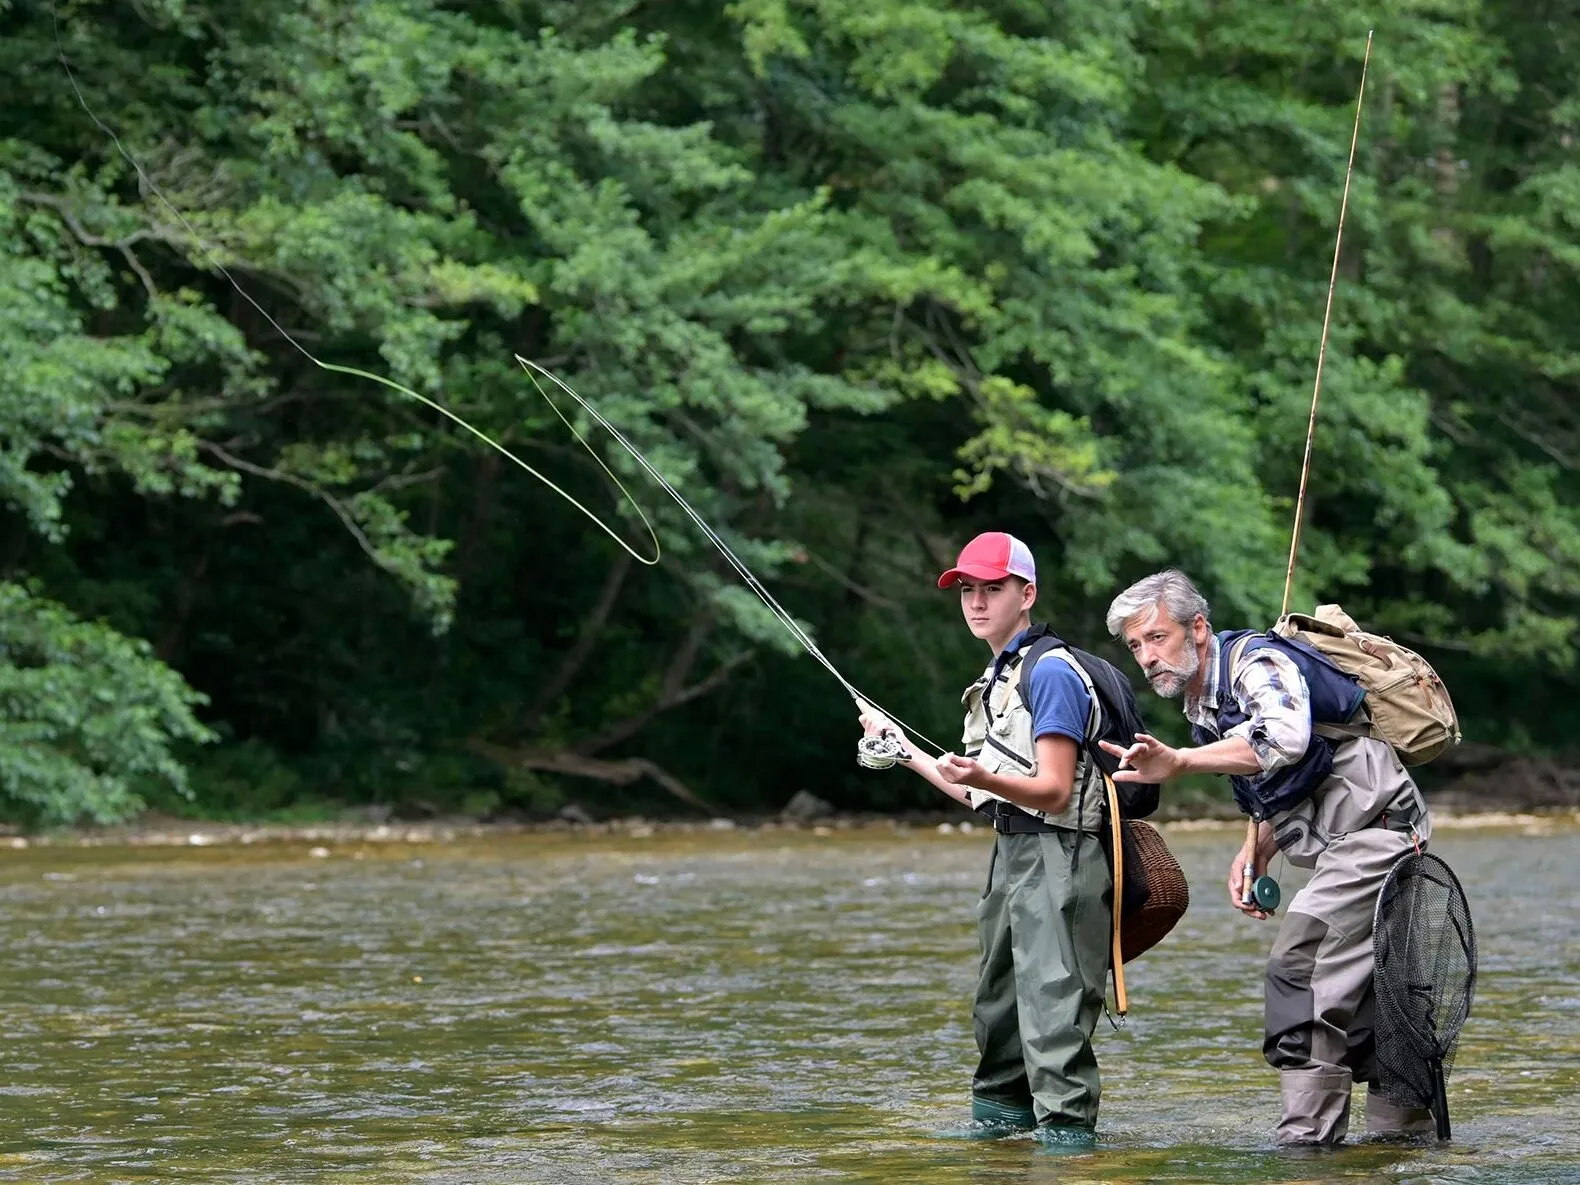
The Roanoke Region is known for its outdoor offerings and culture. Nestled in the foothills of the beautiful Blue Ridge Mountains, this is your gateway to the finest outdoor opportunities available on the East Coast.
The Roanoke Region attracts a diverse cross-section of the United States population thanks to that great outdoor vibe in a location that provides an ideal business environment and lifestyle that can’t be beat.
Population by Locality
| Locality | 1980 | 1990 | 2000 | 2010 | 2020 | 2023 |
|---|---|---|---|---|---|---|
| Alleghany County | 19,379 | 17,855 | 17,215 | 16,250 | 15,223 | 14,943 |
| Botetourt County | 23,270 | 24,992 | 30,496 | 33,148 | 33,596 | 33,466 |
| Franklin County | 35,740 | 39,549 | 47,286 | 56,159 | 54,477 | 54,182 |
| City of Roanoke | 100,220 | 96,397 | 94,911 | 97,032 | 100,011 | 99,045 |
| Roanoke County | 72,945 | 79,332 | 85,778 | 92,376 | 96,929 | 96,519 |
| City of Salem | 23,958 | 23,756 | 24,747 | 24,802 | 25,346 | 24,985 |
| City of Covington | 9,063 | 7,198 | 6,303 | 5,961 | 5,737 | 5,567 |
| Roanoke Region | 284,575 | 289,079 | 306,736 | 325,728 | 331,319 | 328,707 |
Population by Race
| Locality | White | Black or AA | American Indian | Asian | Hispanic (any race) | Two or More Races |
|---|---|---|---|---|---|---|
| Alleghany County | 90.1% | 4.5% | 0.2% | 0.4% | 1.2% | 3.8% |
| Botetourt County | 91.3% | 2.7% | 0.2% | 0.7% | 2.3% | 4.0% |
| Franklin County | 85.7% | 7.2% | 0.3% | 0.6% | 3.6% | 4.5% |
| Roanoke County | 83.3% | 5.9% | 0.3% | 3.6% | 3.6% | 5.3% |
| City of Covington | 79.9% | 12.5% | 0.4% | 0.6% | 3.1% | 7.5% |
| City of Roanoke | 57.3% | 27.5% | 0.4% | 2.5% | 8.5% | 5.4% |
| City of Salem | 82.5% | 7.7% | 0.2% | 2.1% | 4.3% | 5.6% |
| Roanoke Region | 76.9% | 12.5% | 0.3% | 2.1% | 4.9% | 5.6% |
Population by Age Group
| 2010 | 2010 (percentage) | 2021 | 2021 (percentage) | 2026 Projected | 2026 Projected (percentage) | |
|---|---|---|---|---|---|---|
| Under 20 | 78,440 | 24.1% | 71,910 | 21.6% | 72,380 | 21.5% |
| 20-34 | 54,787 | 16.8% | 56,882 | 17.1% | 53,941 | 16.0% |
| 35-54 | 92,554 | 28.4% | 81,004 | 24.3% | 81,015 | 24.1% |
| 55-64 | 46,236 | 14.2% | 49,036 | 14.7% | 45,752 | 13.6% |
| 65 and older | 53,711 | 16.5% | 74,159 | 22.3% | 83,574 | 24.8% |
| Median Age | 42.1 | 44.7 | 45.3 |
Households-Roanoke Region
| 2010 | 2021 | 2028 Projected | |
|---|---|---|---|
| Number | 135,364 | 140,349 | 141,404 |
| Median Household Income | $44,530 | $61,386 | $69,461 |
Household Income Distribution
| 2010 | 2023 | 2028 Projected | |
|---|---|---|---|
| Under $35,000 | 51,053 | 41,501 | 37,779 |
| $35,001-$50,000 | 22,760 | 15,701 | 13,988 |
| $50,001-$75,000 | 26,163 | 23,682 | 22,742 |
| $75,001 and above | 35,819 | 59,464 | 66,891 |
Educational Attainment (ages 25 and over)
| Under 12 years | 9.5% |
| 12 years only | 32.0% |
| Some college | 30.1% |
| College graduates (16 years or more) | 28.4% |
We’re here to help
The Roanoke Regional Partnership serves as the point of contact for businesses looking to relocate and expand. We are connectors who match your needs and questions with the resources and answers. We’re a one-stop-shop for learning, evaluating, and connecting with the Alleghany, Botetourt, Franklin, and Roanoke counties, cities of Covington, Roanoke, and Salem, and the town of Vinton.
Let us help you find the right site or building for companies, create custom research for your business decision, and connect you with the people and services that will help you see why the Roanoke Region is the right place.
